
A Passionate data Analyst & data Scientist in Training for transforming raw data into actionable insights.
My journey in data analytics blends curiosity with precision, where I orchestrate the extraction of patterns and narratives from complex datasets.
Equipped with a diverse palette of analytical tools and methodologies, I specialize in meticulous data cleaning, transformation, advanced statistical modeling And ML modeling.
My expertise extends to predictive analytics and machine learning, where I utilize algorithms such as recurrent neural networks and ensemble methods to empower informed decision-making.
Beyond crunching numbers, I craft compelling data stories through visualization tools like Tableau, Power BI,Dash, Plotly and HTML data visualization by WebDriver Graphs.
Each dashboard and report I create aims to simplify complexity and inspire action.
In my pursuit of excellence, I embrace the challenge of new frontiers, exploring innovations in blockchain and decentralized finance (DeFi) with a curious mind and analytical rigor.
Outside the realm of data, you'll find me immersed in the art of continuous learning, perpetually seeking to expand my skills and insights through exploration and experimentation.
"Cheers to intelligence 💡, Proudly lifting up AI 🤖 , Honoring science 🧬, algorithms and the brilliant minds behind the code. 🚀🧠
Keep exploring 🔍!! Embrace the journey, stay curious, and let's achieve 🏆 greatness together!" ✨ 🌍
.gif)
(WHO Data cleaning, Data transformation, Data Normalization, Data Engineering, Data modeling, ERD Dia, Exploratory Analysis,CO-Relations, Data visualization)
Data is collected on large set from different four topic sources which are mentioned below. 1.Married-or-in-union-women-of-reproductive-age who-have-their-need-for-family-planning-satisfied-with-modern-methods, 2.Adolescent-birth-rate-(per-1000-women-aged-15-19-years), 3.Antenatal-care-coverage-at-least-four-visits, 4.Births-attended-by-skilled-health-personnel. - Analysis is related to How Among married or in-union women of reproductive age, impact reproductive health outcomes, maternal well-being rates are varying around the world.
(Note: For more details, click on Repository)
Repository Code ERD Results
(Web-Scraping by using Beautiful-Soup & Splinter with Exploratory Analysis)
Have learned to identify HTML elements on a page, identified their id and class attributes, and used this knowledge to extract information via both automated browsing with Splinter and HTML parsing with Beautiful Soup. Also have learned to scrape various types of information. These include HTML tables and recurring elements, like multiple news articles on a webpage. As have worked on this, has strengthened the same core skills that i have been developing: collecting data, organizing and storing data, analyzing data, and then visually communicating insights.
(Note: for more details click on Repository)
Repository Code Derived GraphsThrilled to present our Pneumonia Detection Dashboard, a desktop application utilizing the VGG16 architecture for high-accuracy image analysis. Leveraging TensorFlow-Keras and a PyQt5 GUI, it provides real-time results with color-coded feedback and text-to-speech announcements. Built with Python, PIL, win32com, NumPy, and threading, it enhances accessibility and efficiency in clinical settings.
(Note: For more details, click on Repository)
Repository ML Model APP Demo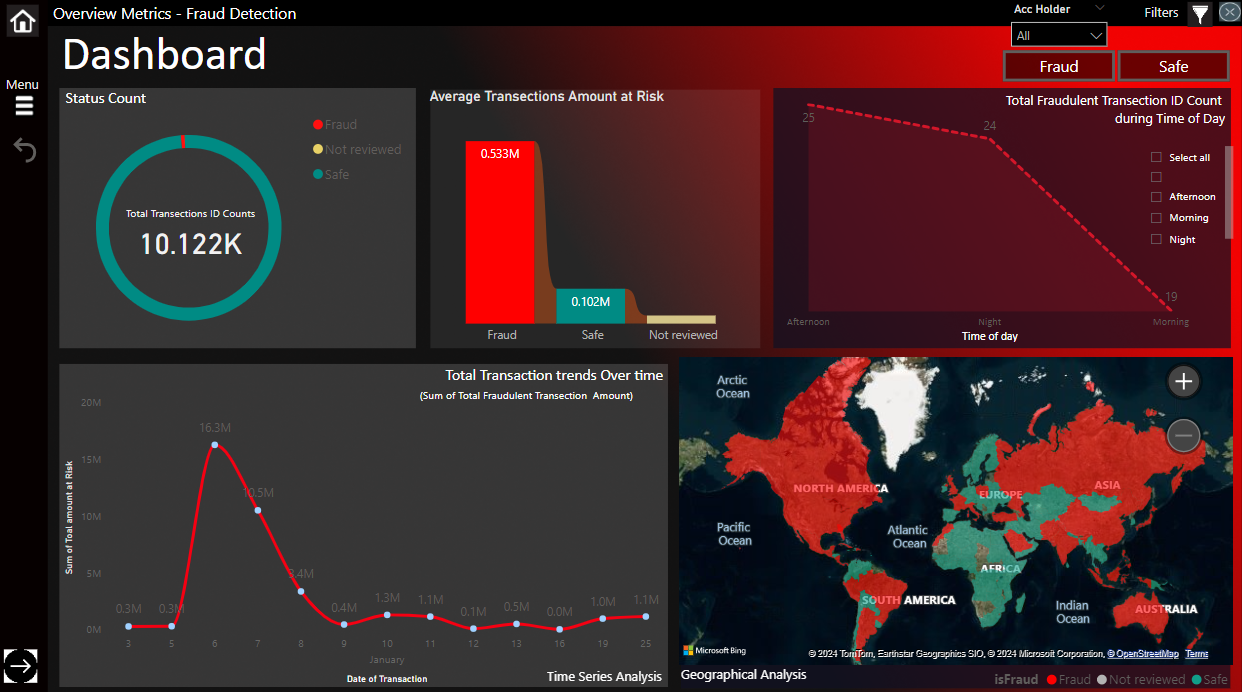
Dashboard screens:
(Note: For more details, click on Repository)
Repository Demo Published DB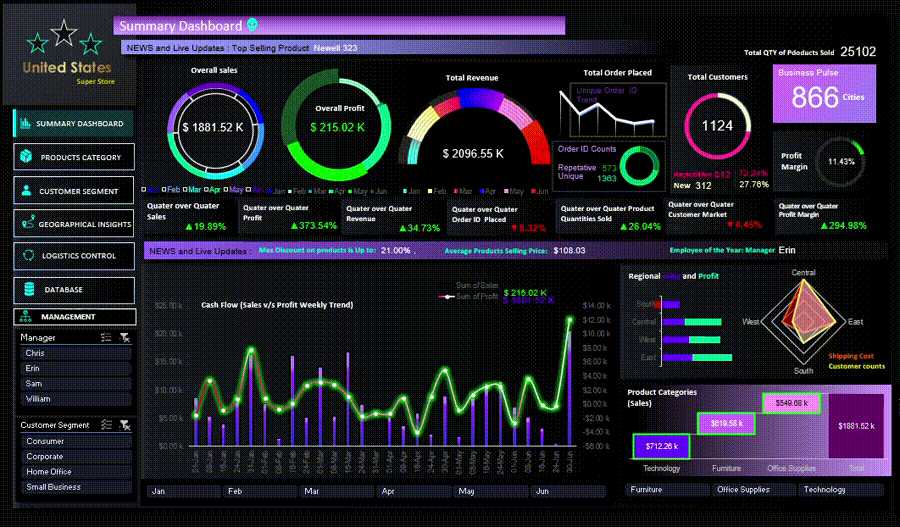
Dashboard screens:
(Note: For more details, click on Repository)
Repository Dashboard NavigationThrilled to introduce our Flask API-powered Machine Learning dashboard, a sophisticated tool for medical predictions and personalized recommendations. This platform enables users to input symptoms and receive precise diagnoses.
(Driven by a Linear Regression ML model, Beyond identifying potential conditions, It offers detailed insights, including disease descriptions, precautionary measures, workout regimens, tailored medications, and diet plans INCLUDED synonym dictionary and automatic spelling correction)
(Note: For more details, click on Repository)
Repository ML Model Web-DB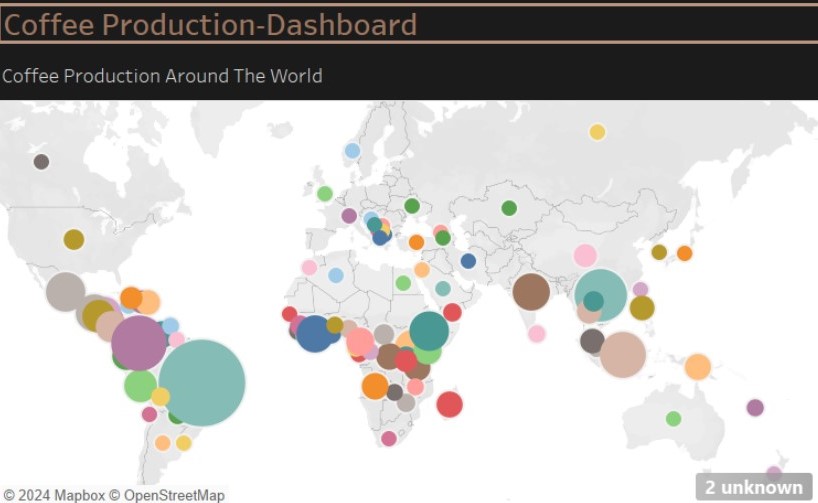
This Tableau dashboard offers a focused analysis of global coffee production, highlighting the relationship between domestic consumption and import/export trends. It includes:
(Note: For more details, click on Repository)
Repository Published Dashboard(Python 3.x, Flask, SQLAlchemy, Pandas, Matplotlib, NumPy,automap_base(), create_engine, App Design, Home Route, Precipitation Data,Station Data,Temperature Observations, EDA)
This project is a Flask application designed to serve as an API for climate analysis data derived from a SQLite database. The API provides several endpoints that allow users to retrieve precipitation, station, and temperature data, as well as perform basic statistical analysis based on user-defined start and end dates. The data used in this project comes from the "hawaii.sqlite" database, which contains climate data for various weather stations in Hawaii
(Note: For more details, click on Repository)
Repository Code APP Code
(Data Collection, Data Cleaning, Transformation, Normalization, Engineering ERD, Exploratory data analysis, Geographical Analysis, Visualization )
Welcome to the Women’s Maternal and Reproductive Health project, a comprehensive data-driven exploration into the access and satisfaction of family planning needs among married or in-union women of reproductive age (15-49 years). This project focuses on analyzing how access to modern family planning methods varies across different regions and socioeconomic groups globally, using data sourced from the World Health Organization (WHO).
This repository provides an in-depth look into the fascinating journey of crafting data engineering pipelines designed for meticulous data analysis. Our primary goal is to explore how access to modern family planning methods, which significantly impact maternal health outcomes, differs by region and socio-economic factors.
(Note: For more details, click on Repository)
Repository ERD Norm. ViZ
(The analysis also includes key performance indicators (KPIs) and a geographical map visualizing the distribution of content across regions, providing a comprehensive view of Netflix's global reach.)
This analysis delves into the Netflix dataset to uncover key insights about the platform's content offerings, focusing on runtime statistics, ratings, and release patterns. The main objectives include:
(Note: for more details click on Repository) Repository Exploratory Analysis
(pie-chart, pandas-dataframe, linear-regression, looping, barchart, variance, matplotlib, outlier-detection, boxplot, summary-statistics, datavisualization, correlation-coefficient, pandas-library, scatterplot-visualization,barchart, pandas-dataframe, boxplot, summary-statistic, pie-chart, looping)
Pymaceuticals, Inc., A new pharmaceutical company that specializes in anti-cancer medications. Recently, it began screening for potential treatments for squamous cell carcinoma (SCC), a commonly occurring form of skin cancer.
the company,have been given access to the complete data from their most recent animal study. In this study, 249 mice who were identified with SCC tumors received treatment with a range of drug regimens. Over the course of 45 days, tumor development was observed and measured. The purpose of this study was to compare the performance of Pymaceuticals’ drug of interest, Capomulin, against the other treatment regimens. Also, client needed, technical report of the clinical study. They have also asked you for a top-level summary of the study results.

(Part 1: Database and Jupyter Notebook Set Up, Part 2: Update the Database, Part 3: Exploratory Analysis)
The UK Food Standards Agency systematically assesses food establishments across the United Kingdom, assigning hygiene ratings to ensure public safety. The editors of Eat Safe, Love, a prominent food magazine, sought an analysis of these ratings to uncover insights that would guide their journalists and food critics in selecting topics for future articles.
(Note: for more details click on Repository)
Repository Code Analysis
(A Linux environment, Apache Spark (version 3.5.0 used in this example), Java (OpenJDK 11 used here),Google Colab)
This project demonstrates Spark SQL's capabilities for data analysis using a home sales dataset. It covers:
(Note: for more details click on Repository) Repository G-Colab Code

(api_keys.py, URL based API, .gitignore, Automation, Python, Git, Geoapify API, OpenWeatherMap API, hvPlot)
Part 1: WeatherPy
In this section, the goal was to create a Python script to visualize weather data for over 500 cities, varying in distance from the equator. By utilizing the citipy library and the OpenWeatherMap API, you developed a model to represent weather conditions across these cities. The project involved:
Part 2: VacationPy
In this part, applied weather data insights to plan vacations using map visualizations. Key tasks included:
(Note: for more details click on Repository) Repository Code Results

(Exploratory Analysis, Findings, Patterns, Co-relations And hypothesis Testing)
Here topic selected by our Project team is surrounding fraudulent e-commerce transactions With two data sets merged, we filtered out the legitimate transactions to analyze the fraud transactions among a vast variety of categories: Age, transaction amount, payment method etc & Hypothesis Testing For Device Used "Mobile Category".
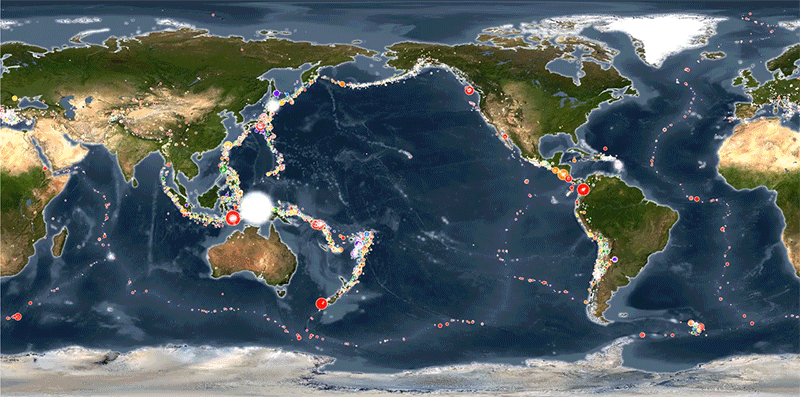
This project focuses on visualizing global seismic activity and its relationship with tectonic plate movements using real-time data from the United States Geological Survey (USGS).
By leveraging the power of Leaflet.js for interactive mapping, the visualization highlights earthquake magnitudes, depths, and locations. The map provides an intuitive way to explore seismic events, with dynamic markers that reflect earthquake size and depth. Additionally, the project incorporates tectonic plate data, allowing users to visualize seismic activity in the context of tectonic boundaries, offering valuable insights into the Earth's geophysical processes.
(Note: for more details click on Repository)
Repository HTML code Logic.js
In this Project, various techniques were used to train and evaluate a model based on loan risk. A dataset of historical lending activity from a peer-to-peer lending services company was utilized to build a model that could identify the creditworthiness of borrowers.
The instructions for this challenge were divided into the following subsections:
(Note: for more details click on Repository)
Repository Regression Report
(SQL data base, Primary keys, Foreign keys, ETL pipeline, Python dictionaries, Data Engineering, ETL, ERD, PostgreSQL_table-schemas)
In this Project has an ETL work flow, have worked with ETL pipeline using Python, Pandas, and either Python dictionary methods or regular expressions to extract and transform the data. After transforming the data, have followed the steps to create four CSV files Exctracted by python (Category, Sub- category Data Frame,Campaign DataFrame,Contacts Data Frame)and used the CSV file data to create an ERD and a table schemas. Finally, have uploaded the CSV file data into a #Postgres SQL database.
(Note: for more details click on Repository)
Repository SQL Code ERD Dia
(K-means, Machine Learning)
In this Project, knowledge of Python and unsupervised learning was used to predict whether cryptocurrencies were affected by 24-hour or 7-day price changes. The summary statistics were obtained, and the data was plotted to visualize it before proceeding.
(Note: for more details click on Repository)
Repository Code Results
PyBank Analysis
In this Analysis, created a Python script to analyze the financial records of Banking company. Financial dataset was given called budget_data.csv. The dataset Was composed of two columns: "Date" and "Profit/Losses"
PyPoll Election Results Analysis
In this Analysis, with helping a small, rural _town modernize_ its vote-counting process, a set of poll data was given called `election_data.csv`. The dataset was composed of three columns: "`Voter ID`", "`County`", and "`Candidate`". My task was to create a `Python` script that analyzes the votes and calculates each of the following values:

This comprehensive analysis of sales data aims to provide actionable insights into revenue generation, pricing strategies, and overall profitability, supporting data-driven decision-making and strategic business enhancements.
(Findings includes 1.Quantity of item 10 sold by John Jones?, 2. Top 3 highest selling items by quantity?, 3. Highest selling item by a single salesperson?, 4. Wendel’s total sales?, 5. Invoices created by Sally? 6. Top postal code for item 5 in May? 7. Postal codes with more than 400 products bought in February? 8. Top 3 items by dollars spent for postcode 3020? 9. Salespersons ranked by invoices in May? 10. Largest invoice by Wendel? 11. Salespersons ranked by discount value? 12. Month with highest revenue? 13. Highest profit item for selected postal codes in February? 14. Month rank by profit? 15. Top 3 profitable months for John Jones? 16. Quantity of item 3 sold by Benny and Kelly in June?)
(Note: for more details click on Repository)
Repository Trends and Patterns(Data Analysis, structuring, manipulation by Python)
The analysis focused on evaluating the academic performance of schools based on various factors such as school type, size, and per student budget. It examined average math and reading scores, as well as the percentage of students passing math, reading, and overall. The data revealed significant differences between Charter and District schools, with Charter schools consistently performing better across all metrics. Additionally, the analysis explored the relationship between per student budget and academic performance, noting that higher budget allocation did not always correlate with better outcomes.
This suggests that how factors beyond financial resources, such as teaching quality and school culture, may influence student achievements.
Overall, the analysis highlights the importance of considering multiple factors when assessing school performance and emphasizes the need for further investigation into effective educational practices.
(Note: for more details click on Repository)
Repository Code Findings
(Results includes 1. Analysis Of High Profit Product Sub-Categories As Per The Regions,2. Branching Highest Profit Product Sub category(Districts) to gain more insights withing that Region, 3. Analysis Of High Loss Making Product Sub-Categories As Per The Regions, 4. Data Filtered for Cost Analysis for Tables and Bookcases as per Price and Margin on that., 5. Cost and Margin Analysis Of Tables and book case's as per High loss making Sub category of Products (Further Branching Regions in to the sub categiries(District) to gain some more Info about geographical analysis))
The Sales and Profit Analysis aims to provide a comprehensive understanding of the financial performance of the Superstore across various dimensions. By examining sales and profit metrics, this analysis seeks to uncover key trends, identify areas for improvement, and optimize business strategies.
(Note: for more details click on Repository)
Repository Analysis Results
This project focuses on building and optimizing a deep learning model to predict the success of charity funding applications for the Alphabet Soup organization. The dataset includes various features related to the charity applications, and the goal is to create a binary classification model to determine whether an application will be successful If Funded by Alphabet Soup.
The purpose of this project was to develop a machine learning model capable of predicting the success rate of charity applications. The project involved data preprocessing, model building, compilie, Train, evaluating and optimization using a neural network implemented with TensorFlow.
(Note: for more details click on Repository)
Repository Report ML Model


"Embark with me on this journey where data becomes art Where we unlock the narratives hidden within and shape a future powered by informed decisions and transformative insights."
_Roshni.png)
(Roshni-Laura).png)